Revolutionize your decision-making process with data visualization services. We transform complex data into clear and insightful visual masterpieces. Our custom design, seamless data integration, and machine learning tools help you extract valuable insights from large datasets and confidently make bold decisions.
At the heart of our data visualization services lies a powerhouse of capabilities designed to bring your data to life. Our services are crafted with precision, expertise, and a deep understanding of the transformative power of data visualization.

Experience the peak of customization with interactive dashboards that track your KPIs and empower you to make data-driven decisions effortlessly. Our mastery of tools like Tableau, Power BI, and Looker help us bring your data to life.
Our consulting services are your compass in the vast data visualization landscape. We guide you through selecting the perfect charts, color schemes, and layouts to tell your data’s story.
Elevate your team’s skills with our tailored workshops and training sessions. We demystify data visualization tools and techniques, empowering your team to use them confidently.
Merge the power of analytics with visualization for a deeper dive into your data. Turning analytics data into digestible visuals unlocks hidden insights for better decision-making.
Our custom development tailors visualization solutions to your business needs and client data requirements when off-the-shelf products fall short.
Our data visualization services seamlessly integrate with your existing systems, making our dashboards a natural extension of your business operations, enhancing efficiency and data accessibility.
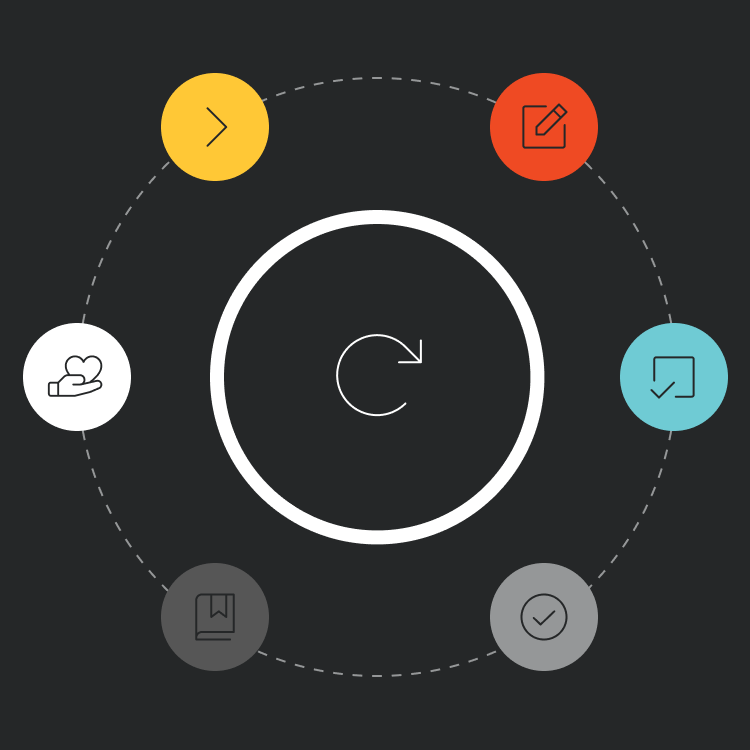
Our data visualization services are crafted to take you from ambiguity to insight. We use visualization to transform data into a strategic asset. Here’s how we do it:
Our journey begins with a meeting to understand your needs and requirements. In our discovery sessions and data maturity assessment, we peel back the layers of your current data landscape, hunting for insights, obstacles, and opportunities.
Our relationship doesn’t end at deployment. We offer ongoing support and development so your data infrastructure remains robust and responsive to your evolving needs.
We don’t just hand over the keys; we teach you how to drive. Our data workshops provide hands-on training and strategic insights, equipping your team with the skills and knowledge to harness the full potential of your data assets.

Post-discovery, we assess your unique challenges to develop a custom blueprint that charts the path to data-driven success — ensuring a smooth and streamlined journey.
Our commitment to excellence shines in our rigorous testing phase. We scrutinize every aspect, fine-tuning until perfection is not just pursued but achieved. Regular updates keep your products relevant and aligned with your vision.
Launching the solution is just the beginning. Our data visualization services ensure new digital products integrate flawlessly with your existing ecosystem, transforming your operations without missing a beat.
Our journey begins with a meeting to understand your needs and requirements. In our discovery sessions and data maturity assessment, we peel back the layers of your current data landscape, hunting for insights, obstacles, and opportunities.
Post-discovery, we assess your unique challenges to develop a custom blueprint that charts the path to data-driven success — ensuring a smooth and streamlined journey.
Our commitment to excellence shines in our rigorous testing phase. We scrutinize every aspect, fine-tuning until perfection is not just pursued but achieved. Regular updates keep your products relevant and aligned with your vision.

Launching the solution is just the beginning. Our data visualization services ensure new digital products integrate flawlessly with your existing ecosystem, transforming your operations without missing a beat.
We don’t just hand over the keys; we teach you how to drive. Our data workshops provide hands-on training and strategic insights, equipping your team with the skills and knowledge to harness the full potential of your data assets.
Our relationship doesn’t end at deployment. We offer ongoing support and development so your data infrastructure remains robust and responsive to your evolving needs.
Public sector solutions that centralize and transform government data into predictive and actionable intelligence so you can make smarter, faster decisions.
28%
Organizations using visual data discovery tools are 28% more likely than their peers to use just managed reporting and dashboards to find timely information.*
60K
Visual information is processed 60,000 times faster by the brain than text. **
5-6%
Companies in the top third of their industry using data-driven decision-making were, on average, 5% more productive and 6% more profitable than their competitors.***
*Visualization, Set Your Analytics Users Free, The Aberdeen Group
**The UM/3M Study. Management Information Systems Research Center School of Management, University of Minnesota
***Big Data: The Management Revolution, Harvard Business Review
With our data visualization services, you don’t just get charts and graphs; you unlock a new realm of understanding and decision-making. Here’s what’s in store for you:
Stay relevant with visualizations that update in real time. Perfect for dynamic data sets, they offer up-to-the-minute insights for swift decision-making.
Our data cleansing and preparation capabilities prime your data for visualization. These data engineering services help you leverage quality insights to make swift, confident decisions.
Access your data anywhere, anytime with our mobile app development services. Designed for the modern workforce, they ensure your insights are always within reach.
We believe in data visualization services that everyone on your team can use. Our designs adhere to the highest accessibility standards, ensuring everyone can derive value from your data.
Uncover the geographical dimension of your data with our map-based visualizations. Ideal for location-based insights, they provide a unique perspective on your data.

– Next Digital Program Lead, Google Cloud

A top-tier physical medicine and rehabilitation research hospital sought to enhance patient care and improve health outcomes. The challenge was to develop a dashboard that could help providers visualize and predict patient recovery trajectories, enabling healthcare providers to tailor their approaches for optimal patient care.
The client chose Nerdery for its data visualization experience and ability to integrate machine learning capabilities. We leveraged AWS’s enterprise-level scalability, ensuring the model’s seamless operation in the cloud and infinite scalability. The predictive analytics feature transformed the healthcare provider’s understanding of patient recovery paths, presenting a comprehensive view of each patient’s current status, future trajectory, and cohort score for a nuanced risk and profile assessment.
Implementing this cutting-edge platform marked a significant advancement in the organization’s patient care. Providers were empowered with unprecedented insights into their patients’ journeys, enabling a more informed and personalized approach to care. The centralization of multifaceted data points allows for an optimized care strategy, significantly increasing positive health outcomes.
Turn your data into an actionable story